1. Source Survey
2. Quantitative Results
1. Source Survey
See the explanations in the menu item: Secular Jurisdiction
2. Quantitative Results
As outlined in the menu item marriage proceedings, we were able to determine a total of 77 married couples who conducted a total of 86 proceedings at the St. Pölten and Vienna marriage courts in the examined time segments of the period from 1857 to 1868. The legal interest of the plaintiff spouse was predominantly the divorce from bed and board (95.5%). As in the other time segments studied, it was overwhelmingly the women who files for divorce: 61 (70.9%) of the divorce petitions were initiated by wives, and 22 (25.6%) by husbands.
In one lawsuit each, the wife sought the annulment of the marriage, an order for cohabitation, and the resumption of cohabitation.
What do we know about these 77 wives and husbands? As with the other time segments, we have endeavoured to systematically augment the information obtained from the documents of the proceedings with further personal data. Once again, we used primarily the marriage, baptism and death registers of the parishes, which are available as digital copies on Matricula Online.
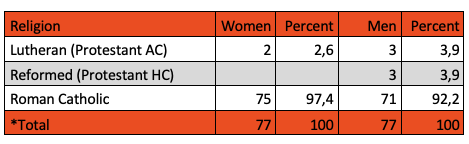
RELIGION
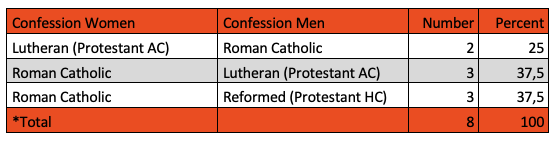
As the tables below show, by far the majority of the 77 married couples were members of the Roman Catholic Church. It is noteworthy that as many as eight married couples (10.4%) were interdenominational, whereby also in this time segment it was clearly more often the husband who did not belong to the Roman Catholic denomination.
Table 1 a and 1 b: Religion of Spouses
Interdenominational Married Couples
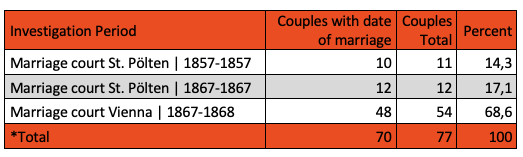
DATE OF MARRIAGE
As the table below shows, we were able to determine the date of marriage for just over 90 percent of the married couples. 23 couples conducted the proceedings before the episcopal marriage court in St. Pölten and 54 before the episcopal marriage court in Vienna.
Table 2: Investigation Period | Date of Marriage
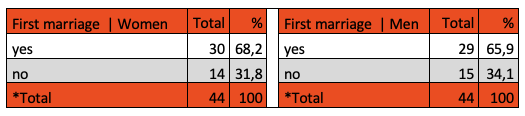
MARITAL STATUS | WEDDING
We know the marital status of approximately half of the married couples at the time of their marriage. Compared to the married couples in the previous study periods (1783-1850), it is noticeable that the number of women as well as men who were already widowed at the time of the marriage was significantly higher, at 13.8 and 34.1 percent, respectively. Due to the rather small source sample numbers, however, these statistical results should be interpreted with caution.
Table 3: Marital status at the wedding by gender
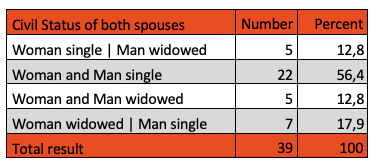
As the next table shows, we were able to determine the marital status of both spouses in 39 married couples. The slightly higher proportion of widowed persons can also be seen in this table. In almost half of the marriages (43.6%) at least one spouse had already been married. At 17.9 percent, the proportion of widows who decided to marry a usually considerably younger bachelor is remarkably high. At almost 13 percent, the constellation of a widow and a widower deciding to spend the rest of their lives as a married couple is higher than in the previous time segment, but lower than in the early modern period.
Table 4: Marital status at the wedding by married couple
MARRIAGE AGE
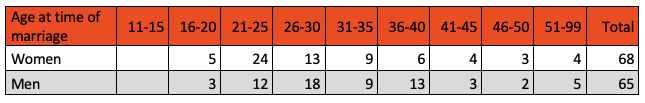
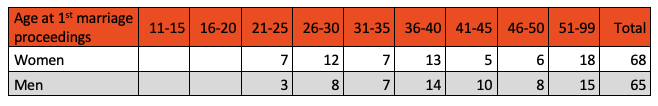
We were able to find out the age of marriage for 68 women and 65 men. As the table below shows, five women and three men were minors at the time of the marriage. With four women and five men, the proportion of marriages where are least one spouse was already older than 50 years of age is astonishingly high. As the table below shows, the largest group of brides is in the age cohort between 21 and 25 years (35.3%), while the largest group of grooms is in the age cohort between 26 and 30 years (27.7%).
Table 5: Age at time of marriage by gender
AGE DIFFERENCE IN MARRIED COUPLES
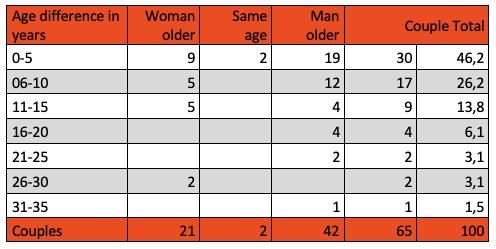
We were able to determine the age of both the husband and the wife for 65 married couples. As the table below shows, only two of the married couples had no age difference. Almost half of the married couples (46.2%) were almost the same age, with an age difference of up to 5 years. Slightly more than quarter of the married couples (26.2%) had an age difference of between 6 and 10 years, with the husband being older in approximately 70 percent of the cases. In married couples with an age difference of more than 11 years, the wife was the older spouse in five cases and the husband in four. Among the five married couples who had an age difference of more than 21 years, the husband was the older spouse in three cases and the wife in two. Since the source sample of married couples with a large age difference is particularly very small, the deviating results for married couples in the other time segments should again be interpreted with caution.
Table 6: Age difference between spouses
DURATION OF MARRIAGE
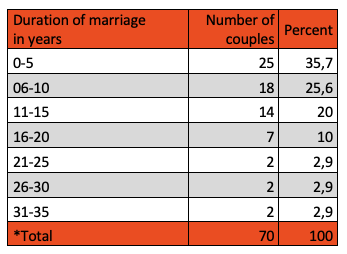
If we relate the date of marriage to the date of the first lawsuit, the result is a picture which is very similar to that of the previous investigation periods. As in the case of married couples between 1783 and 1850, the proportion of married couples where a spouse requested a divorce within the first five years of marriage is slightly more than a third (35.7%). At a quarter, the proportion of married couples where a spouse applied for a divorce after six to ten years of marriage is similarly high. At 8.7 percent, the proportion of married couples who were married for more than 21 years at the first trial before the episcopal marriage courts is also comparably high.
Table 7: Duration of marriage before first marriage proceedings
AGE AT TIME OF DIVORCE PETITION OR LAWSUIT
We were able to determine the ages of 67 women and 63 men when they first brought an action before the episcopal courts. As the table below shows, seven women and three men were under the age of 25 at the time. The number of married couples who were over the age of 50 at the time of the complaint is surprisingly high: 18 women (26.9%) and 15 men (23.8%) were over fifty.
Table 8: Age at first marriage proceedings by gender
SOCIAL STATUS AT TIME OF DIVORCE
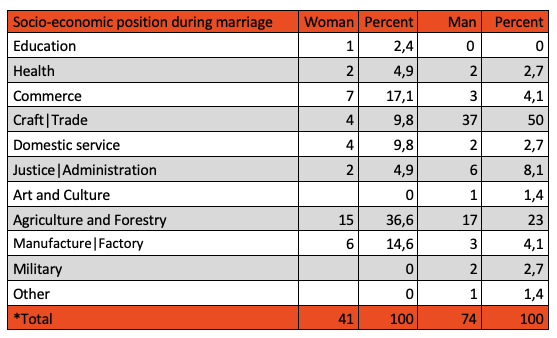
As the table below shows, our knowledge about the husband’s occupation is also greater than that about the wives among these married couples. At 50 percent, the share of men who worked in a craft or trade is again very high. The fact that the proportion of women who worked in agriculture (36.6 percent) is significantly higher than that of men (23 percent) is due not only to the lower density of information on women, but also to the statistical analysis, according to which, in the case of several occupations (e.g. farmer and tailer), we prioritized handicrafts or trades for socio-economic positioning. Compared to the previous periods, far more women and men were assigned to the rural milieu. In addition to trade, in which more than 17 percent of these women worked, the increasing importance of publishing, factory and manufacturing work for the incomes of separated or divorced wives is also striking.
Table 9: Socio-economic status of the spouses by gender
PLACE OF RESIDENCE DURING MARRIAGE
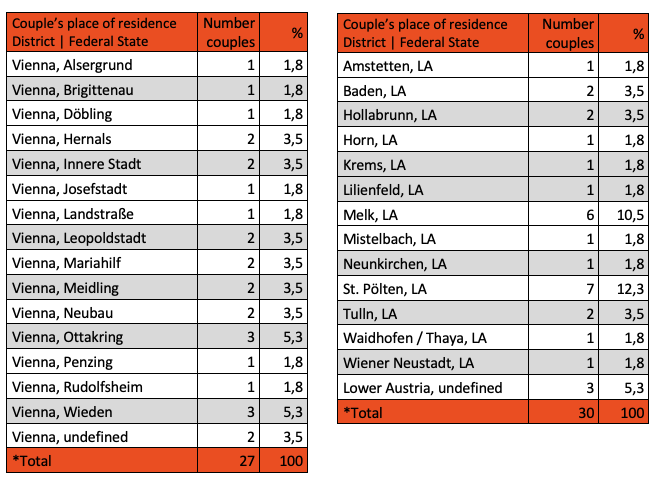
For almost three quarters of the married couples (74%), the common place of residence during the marriage could be reconstructed from the files and minutes. As the table below shows, 27 married couples lived within the present-day city of Vienna, 30 couples in a municipality in Lower Austria. For Vienna – also due to the small number of cases – no concentration of divorce cases on certain residential districts can be determined; In Lower Austria, the districts of St. Pölten and Melk stand out with seven and six married couples, respectively, i.e. together with more than one fifth of the sample (22.8%).
54 of the married couples brought their divorce action before the Venna Marriage Court, 23 before the Diocesan Court in St. Pölten. It should be noted here that the source sample contains appeal proceedings from couples living in Lower Austria or in other areas of the Monarchy. Cf. the menu item Data Collection – Ecclesiastical Courts (1857-1867) – Sources
Table 10: Married couple’s place of residence
Andrea Griesebner, Susanne Hehenberger, December 2020, translation Jennifer Blaak